Crop Scanning
using
Green Atlas
Visualize your whole orchard
Dropcopter has partnered with Green Atlas to deliver their unique scanning approach that combines hardware and software solutions for mapping orchards to provide precise fruit and flower counts, fruit sizing and color evaluation and tree characteristics across entire fields.
How it works
-

Step 1: Coordination
Identify orchard blocks where you would like current crop load information to make a yield estimate or inform decisions regarding maintenance
-

Step 2: Mapping
Dropcopter’s Green Atlas Cartographer unit is driven quickly through all orchard rows gathering LiDAR data and thousands of high-resolution photographs to provide complete information about the crop
-

Step 3: Analysis
Use high resolution AI-assisted mapping to see accurate flower and crop growth patterns across the entire orchard, evaluating fruit counts, color and size, in addition to tree height and canopy/leaf area
-

Step 4: Action
Create accurate yield estimates, or load the information onto smartphones to service over-light or -heavy growth, give precise instructions on thinning to workers or use with variable rate sprayers, root pruners, etc.
We can help with many crops
Currently, we deliver detailed analytics for the following crops:
Almonds
Wine Grapes
Apples
Kiwifruit
Avocados
Macadamia
Prunes
Stone Fruit
Walnuts
Citrus
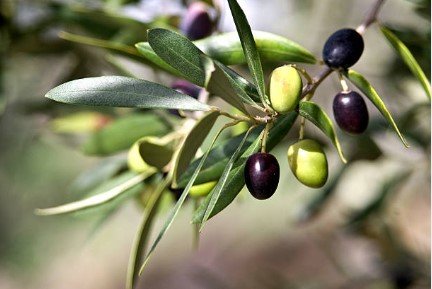
Olives
Pears
More to come!
Table Grapes
Pistachios
Cherries
Mangos
Predict at any stage
Dropcopter’s use of the Green Atlas Cartographer provides the capability to collect and analyze data across the entire spectrum of your crop’s lifecycle, giving meaningful and actionable insights that will help you with on-site operations like thinning, pruning and sanitation. As you move toward harvest, our scans provide critical guidance to purchasing, packing, logistics and marketing.
From pre-flowering through to mature fruit, and between seasons with sanitation, pest and weed management, our technology can be applied progressively to inform immediate action, seasonally to monitor orchard optimization, or year-on-year to assess the effectiveness of long-term management strategies.

Green Atlas FAQ
-
We began using Green Atlas scanning to evaluate the results of our own pollination work. With our growing expertise, we were able to identify other uses for the Cartographer beyond our original set counts. Our experience with crop management can help you optimize your crop’s growth and manage your work force effectively in maitenance efforts.
-
Dropcopter can deliver reports that cover yield estimation, fruit/nut sizing, color data for selective harvest, crop density maps for selective thinning, mummy density maps, tree height, canopy/leaf area data and more. These outputs are all available in one time reports or comparative reports from different points in one season or between seasons.
-
During the scan, data is stored onboard the Cartographer. We transfer this data to a secure processing server for AI-aided recognition of fruit and tree characteristics. Results are delivered to you by specialized reports that show fruit counts and yield estimates (via heatmaps), color and size data (via graphs) and tree geometry.
-
The Cartographer can detect fruit from an early fruit/nutlet stage up to maturity. The specifics depend on the crop. For example, apple fruitlets are typically scanned from 25 mm, while cherry fruitlets and almond nutlets can be scanned under 10 mm.
-
Dropcopter brings experience with growers, independent research companies, Oregon and California Universities and Extension services, vertically integrated packers, state and industry crop data collection agencies, crop insurance carriers and others to help you quickly and effectively evaluate your orchard and direct your efforts to where they are needed most.

We’re happy to help.
Whether you need pollination or scanning solutions, we are one call away.


